Do you remember the year 2019? The good old times when the only viral thing you protected yourself against was the latest Game of Thrones (GoT) spoilers. GoT was a show that went from strength to strength since season 1 and continued even after it caught up with the book material. As someone who had read the first five A Song of Ice and Fire books by July 2011, I stayed away from the TV Series all together till Jon Snow’s revival. With the sixth book still nowhere to be seen, I really wanted to see how the story ends. IMDB rating of GoT was 9+, memes were viral every week, and the whole TV series was booming with fan following. GoT was being compared to all time greats like The Wire, Breaking Bad and Sopranos. Then came the final season bust and that’s how our generation will remember GoT.
While I cannot argue about the ending of GoT, I can understand why GoT last episodes had an avalanche of poor ratings on IMDB. What I consider to be the sole reason is that the “number of watchers” became greater than the “number of followers”. In the end it was a hype train and everyone wanted to be on it. Now the moment something did not go according to the plan, barrage of angry watchers started downvoting it. Lost met a similar fate back in 2000’s. More on that later. For generations to come, there will remain a divide whether the ending was good or not. A major lesson everyone learnt from GoT bust ending is pre-checking if the highly rated TV Series on IMDB is worth our time in the end.
Python for IMDB Rating Analysis
But who is going to check the rating of every episode, every season, every time someone recommends a TV Series? Not me. Why? Because I created a Python program for IMDB rating analysis. All I have to do is enter the 7-digit IMDB code for the TV series in my program and it created a season wise file comparing Episode Rating with Season Rating and TV Show rating.
Was it easy? No. Was is difficult? No. All it needed was a bit of time and effort to understand how different python libraries (pandas, numpy, selenium, beautiful soup, scikit-learn, matplotlib and seaborn)
1. Selenium and Beautiful Soup: To scrap data from IMDB website
2. Pandas: To create the database and work on it
3. Numpy: For simple mathematical calculation (mean)
4. Scikit-learn: For linear regression
5. Matplotlib and Seaborn: For visualization
Now bear with me as I explain how I did it. An easier way of doing it is simply using IMDB python library or downloading the compete IMDB database and then work on it. But where’s the fun in that?
Breaking down the Python code
First step is to install Anaconda – Individual Edition. This way you do not have to install all the above mentioned python libraries. One can open either JupyterLabs or Jupyter Notebook via Anaconda Navigator.
Next step is to breakdown your problem into small parts. A step-by-step approach to reach the final result. I took help from countless sources for this project and will be mentioning them as I go.
1. Scraping data from IMDB website: I can talk about Selenium and Beautiful Soup in length. But its easier if you read directly from the source. Isabella has mentioned the step by step approach she used and I did the same with little tweaks. She has explained how to read HTML as well. Click here to get the basic idea. Isabella’s code will fail if the show is still running. So use try:except wisely within the for-loop. Also I am using select from drop-down menu, so read here how to do that.
2. Creating the database: Once again refer to Isabella’s code. She has explained the data wrangling process in a very simple and precise manner. In addition to Isabella’s work, I have scrapped the overall rating of the TV series. But it is not required to store that data since we will not be computing any calculation on that. Also my code will include the recent episode of the recent season even if the show is currently running.
3. Simple calculations: After the database is cleaned and formatted, use numpy library to find the mean rating of the season. I followed a simple, average season rating = summation of individual episode rating / total number of episodes in the season. While it may sound flawed because number of votes have not be taken into consideration, if you run a simple linear regression between episode rating (dependent variable) and number of votes (independent variable), you would find that there is no good trend line aka R Square value is very low. Linear regression in python is a six line code. Spend 2 minutes on Adarsh’s blog to see the 6-line code.
4. Plotting the graphs: Seaborn is the best data visualization library there is. But it has one very important limitation. You cannot plot multiple lines on the same graph. Hence I was forced to use matplotlib to show TV Series rating and Average Season Rating. Both seaborn and matplotlib are highly customizable totally dependent on your needs.
What result does the Python code for IMDB Rating Analysis show?
Now lets see some of the results. TV Shows I will be covering are:
1. Game of Thrones (2011) : 0944947
2. The Wire (2002): 0306414
3. The Sopranos (1999): 0141842
4. F.R.I.E.N.D.S (1994): 0108778
5. Lost (2004): 0411008
I recommend using this python program for IMDB rating analysis for non-mainstream TV Series or to quickly filter out which episodes of a sitcom you should watch. This shows exactly where GoT went wrong while others flourished. Till the penultimate season GoT was doing great. But the influx of watchers led to the final season of GoT having the maximum number of votes with most of them being highly negative. For all others you can see that the trend line has a positive slope i.e. as the viewers increased, the rating increased.
Now look at Lost’s graphs. As viewers increased, the rating increased. Every season’s average rating is greater than the TV Series rating. Most of the episodes have a better rating than the TV Series rating. So what happened? Remember I mentioned earlier that GoT met the same fate as Lost? This is what I meant by that. Even though the series was good, the vast increase in number of watchers got swayed in whichever direction the wind was blowing.
-

- Game of Thrones – Linear Regression
-

- Game of Thrones – Season 1
-
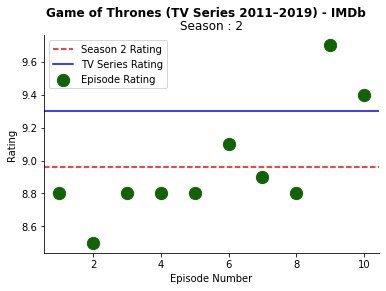
- Game of Thrones – Season 2
-
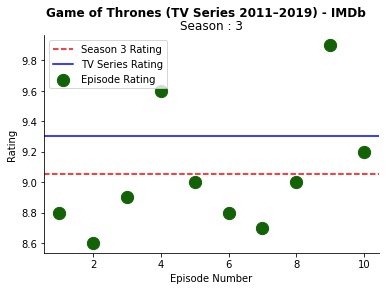
- Game of Thrones – Season 3
-
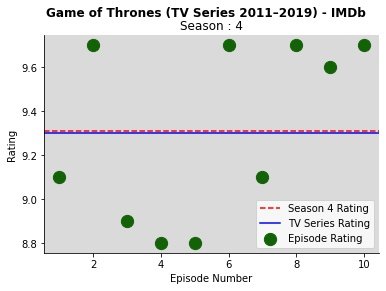
- Game of Thrones – Season 4
-
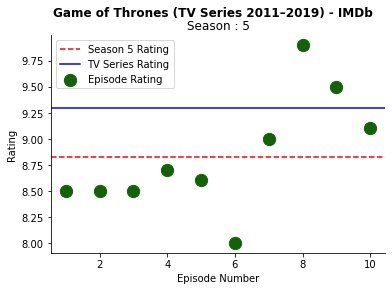
- Game of Thrones – Season 5
-
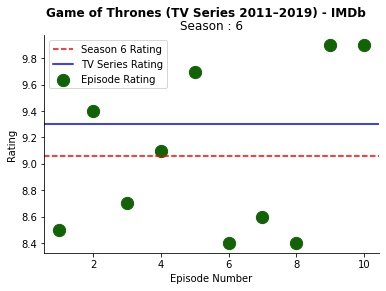
- Game of Thrones – Season 6
-

- Game of Thrones – Season 7
-

- Game of Thrones – Season 8
-
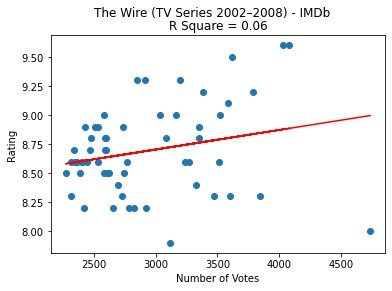
- The Wire – Linear Regression
-
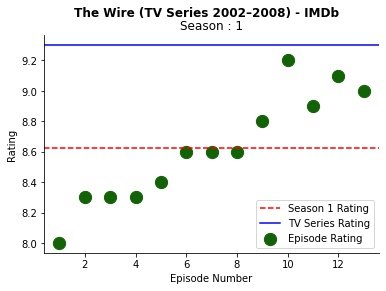
- The Wire – Season 1
-

- The Wire – Season 2
-
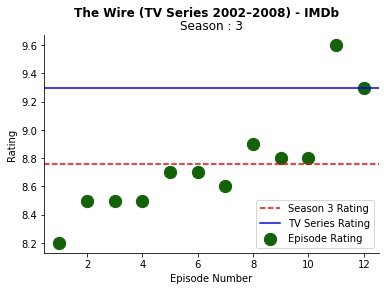
- The Wire – Season 3
-
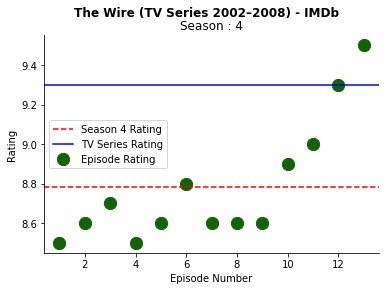
- The Wire – Season 4
-
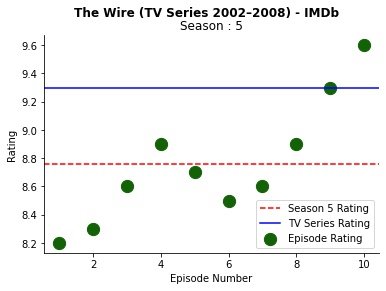
- The Wire – Season 5
-

- The Sopranos – Linear Regression
-

- The Sopranos – Season 1
-

- The Sopranos – Season 2
-
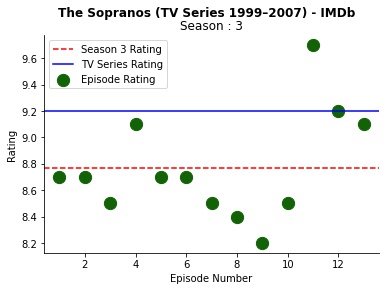
- The Sopranos – Season 3
-
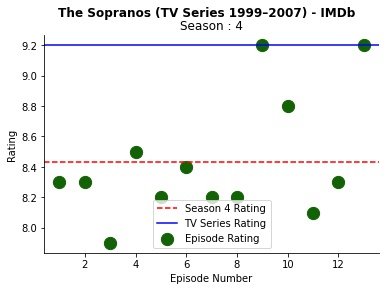
- The Sopranos – Season 4
-
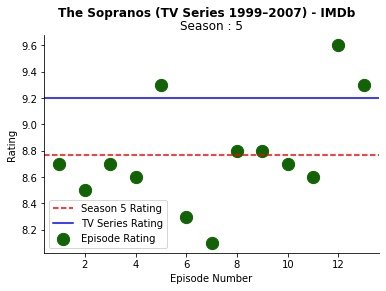
- The Sopranos – Season 5
-

- The Sopranos – Season 6
-

- Friends – Linear Regression
-
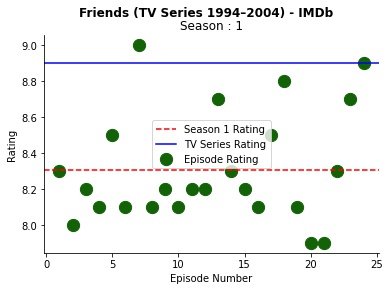
- Friends – Season 1
-
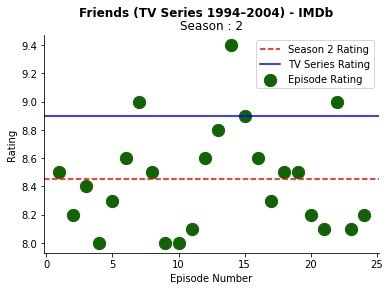
- Friends – Season 2
-
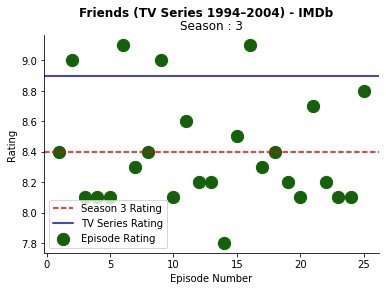
- Friends – Season 3
-
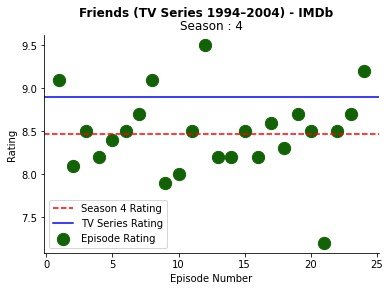
- Friends – Season 4
-
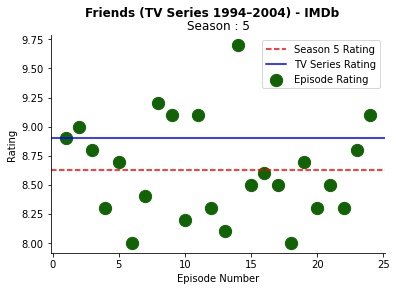
- Friends – Season 5
-

- Friends – Season 6
-

- Friends – Season 7
-
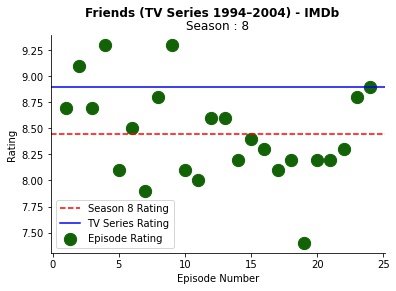
- Friends – Season 8
-
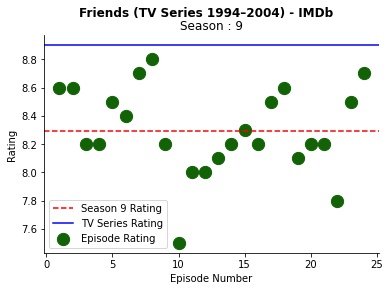
- Friends – Season 9
-
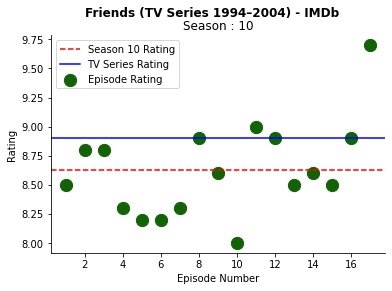
- Friends – Season 10
-
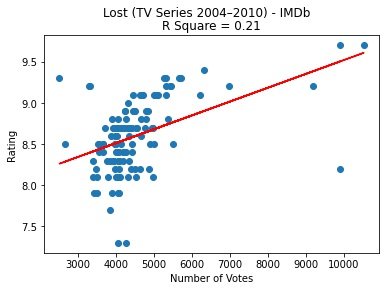
- Lost – Linear Regression
-

- Lost – Season 1
-
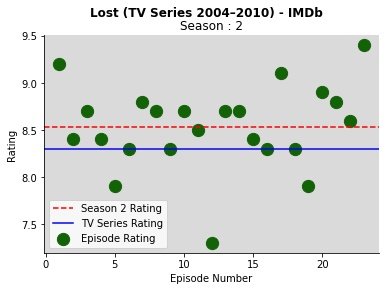
- Lost – Season 2
-
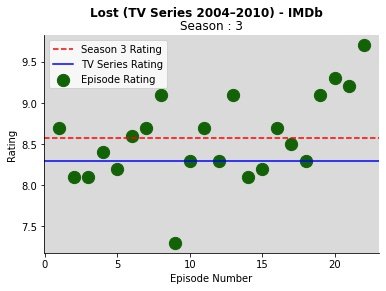
- Lost – Season 3
-
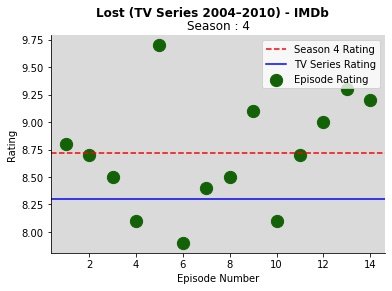
- Lost – Season 4
-
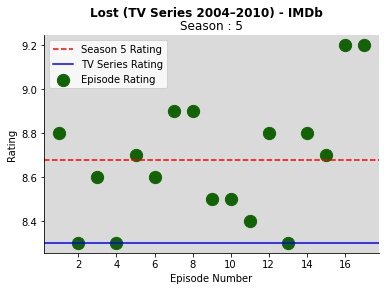
- Lost – Season 5
-
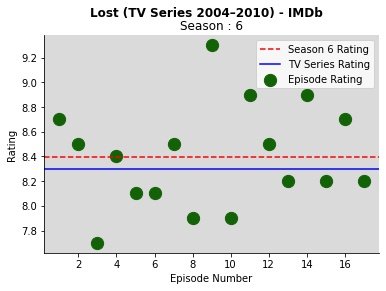
- Lost – Season 6
Contact me via mail or social handles to receive the python code. WordPress doesn’t allow uploading .ipnub files.
Or you can download it directly from my Google drive by clicking here and then contact me if you have any queries.
Note: In case you are looking for a Product Management course, I would highly recommend joining this cohort-based course – ISB Executive Education – Product Management program
PS: You can connect with me for review or referral discount (link for referral discount)